There’s no need to reiterate just how important data is for businesses everywhere. From seeing related advertisements of something you just searched for to getting offers such as free shipping or a cashback on your most frequent purchases; a lot is attributed to analytics derived from data captured at different places, in many ways.
In 2017, big data adoption was reported at 53%, which was 17% in 2015. Despite the increasing popularity of big data, over 84% of CEOs are reportedly concerned about the quality of data that they base their decisions on.
Data these days does not only appear in machine-readable tables; a substantial portion of it is hidden in emails, calls, and paperwork. Additionally, businesses using multiple isolated systems make it difficult to extract actionable insights from data. This is where data integration comes to the rescue.
But before we talk about data integration strategies, it is important to establish what are data quality rules and how are they achieved.
What Are Data Quality Rules?
Data in its raw form cannot be used. It needs to be cleansed and conditioned to eliminate errors, inaccuracies, duplicates, discrepancies, and anything else that distorts the analytics. Data quality rules grade the processed data which is further used for analytics.
Good quality of data translates into high-quality business insights that will help the C-Suite decide for the better of the company. According to research, businesses can lose up to 25% of their total revenue due to bad decisions made by using low-quality data for analysis.
Examples of Data Quality Rules and Dimensions
So how are data quality rules applied? How do businesses ensure high-quality data is fed into the system? There are six data quality dimensions that play an important role in this case. Each of these is illustrated further with data quality dimensions examples for greater clarity.
Completeness
In a world where everybody is short on time, completeness of data requires patience and diligence. Is the business able to collect all the relevant data pertaining to a subject? Or are they missing out on capturing non-critical items? This could be because there’s no standard format for data recording or because they need to save time.
For instance, when capturing an individual’s name: is it captured as first, middle, and last name or are any of these fields left blank? The extent to which a data set is complete (that is, all material attributes of the subject are appropriately captured and no blank values exist) contributes towards data quality, which in turn increases the reliability of analytics driven from it.
Uniqueness
If a data set contains duplicate information on the same business process, it will deviate the analysis. For instance, if a business is trying to measure popularity by quantifying the leads generated from emails and phone calls, there is a possibility that one customer exists in both sets. Using this data will exaggerate the actual measure. Therefore, a business analyst must identify such cases and eliminate them appropriately to give a realistic estimate of business popularity.
When analyzing data, it is important to club or eliminate duplicate data according to a unique identifier in order to make it truly representative of the reality.
Timeliness
These days, data is created at lightning speeds. At much the same rate, data tends to become obsolete as well. This dimension refers to whether the captured data still holds true for the subject(s).
In general, businesses market offerings to a specific segment. For instance, a company wants to launch a service specifically targeting singles, who allegedly are 60% of the population in a given region; timeliness of data will ensure their potential customer lists (based on which they decided to launch such a service in the first place) constitute of the intended demographics.
Imagine a situation where this business suddenly finds out more than half of their target market was wrongly classified due to old data and are no longer a part of their target market!
Validity
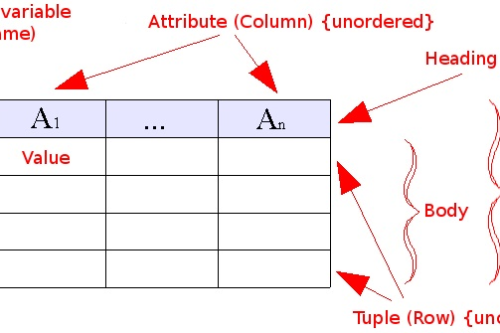
Does the value correspond to the attribute? Or does it say “London” in the field which was supposed to capture gender?
Data validity puts a check on the format of data stored in each cell of the table. After all, if you’re hoping to find the average age of all your customers, your system is more likely to throw an error if one of the cells contains “Bonnie” instead.
Accuracy
Nobody realizes the importance of a centimeter unless it is that last tile on your floor that is just a little bit bigger than the required size and hence doesn’t fit. Data accuracy works the same way and is very closely linked to Validity, Uniqueness, and Consistency.
Data Accuracy issues can stem from as simple things as the date format: if a person intends to record 2nd January in a MM/DD format and inputs it as 02/01 (DD/MM) instead, there’s no mechanical way to rule out such a discrepancy.
Consistency
When you’re verifying a story you have to make sure that everyone you ask tells it the same way. Similarly, data consistency means the subject’s reality doesn’t change from one cell to another. For instance, a customer reports they do not have a car and then go ahead to record $200 as fuel expenses – these values are in clear contradiction with each other. Data consistency is considered high for data sets where such issues do not occur.
How To Use The Six Data Quality Dimensions?
Assessment of data quality framework is not a one-time job. As a business, you need to identify your expectations from the data residing in your systems. Accordingly, you need to prioritize the six data quality dimensions and evaluate what is and isn’t working for you.
For instance, if the data in your systems hasn’t been updated in a long time, it would naturally rank low on Accuracy and Timeliness. If you have a process for deduplicating records, it adds to data quality in terms of Uniqueness, and so on and so forth.
Conduct data quality assessments periodically and focus on how the current assessment compares to the previous one. Make incremental changes to the systems and/or business processes to enhance data quality. The following scorecard gives an insight to how data quality is assessed and recorded.
Assessment Scorecard for Data Quality Dimensions
|
Data Quality Dimension |
Score (from 1-5, with 1 being the lowest and five being the highest) | What’s working? | What can we do better? |
|
Accuracy |
2 | Capture updated data in the system frequently – it has not been updated in the last 10 years | |
| Completeness | 4 | There are very few blank fields in the data table |
|
|
Consistency |
4 | Same piece of information is captured in three ways to establish consistency | |
|
Timeliness |
2 |
Capture updated data in the system directly – it has not been updated in the last 10 years |
|
|
Validity |
5 |
The system doesn’t allow users to input data in incorrect format |
|
| Uniqueness | 4 |
The system shows suggestions if similar data is already available in the system |
|
| TOTAL | 3.67 |
Keep an eye on the average total for quantifying data quality. If you need help with managing and amalgamating your data, feel free to reach out to our data experts.