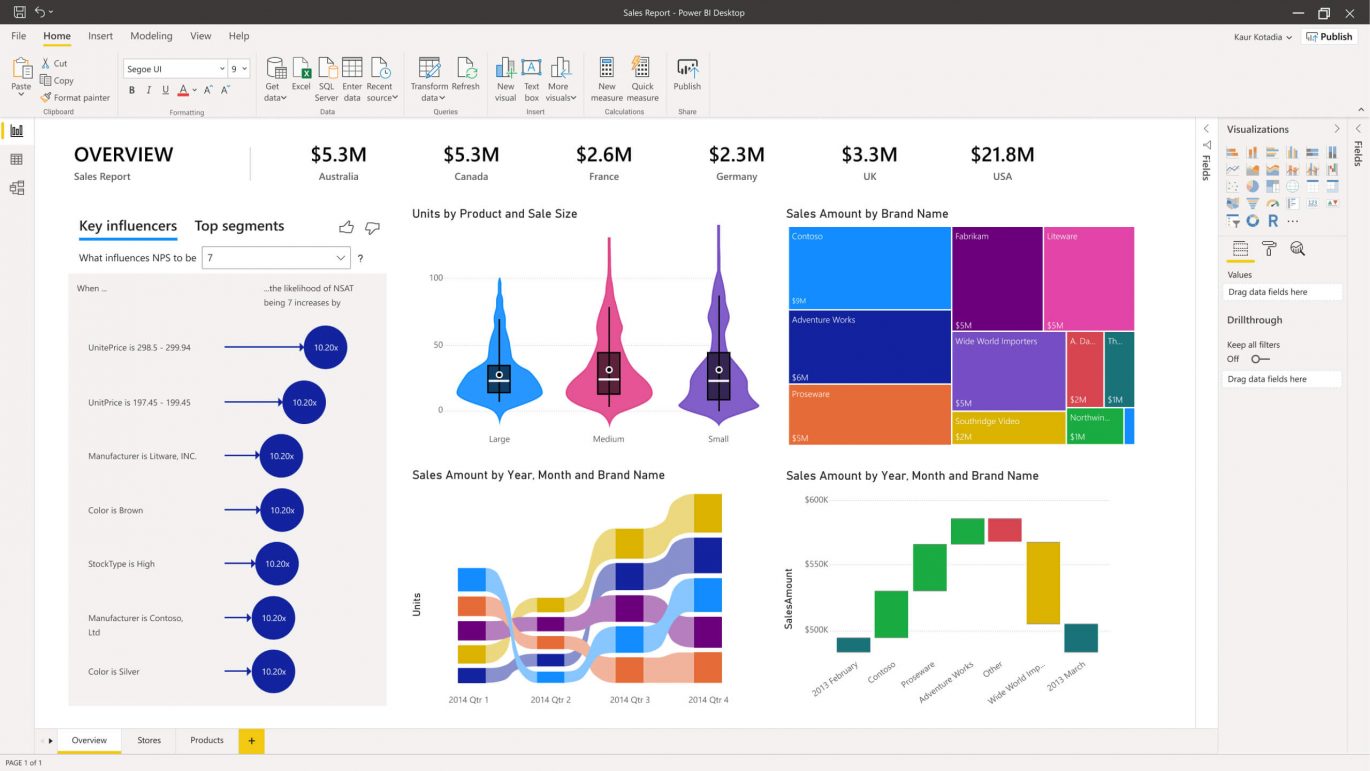
Whether you are exploring data by creating charts and dashboards or asking questions with Power BI Q&A, the visualizations and answers you see are getting their underlying data from a dataset. This dataset comes from a data source. There are different types of data sources available.
In this article, we’re going to cover everything you need to know about Power BI data integration.
Power BI Data Integration from Multiple Sources
The strength of Power BI lies in its capacity to integrate data from multiple sources of different types. This extensive tool for building interactive analyses allows you to create a common data model and aggregate data from many sources such as databases, online services, and different files.
Using Power BI, you can connect to multiple data sources at the same time and design a data model for business analysis. You can add new sources using the Power Query editor built into Power BI. It is used to transform or edit data files before they are actually loaded into the Power BI. The Power Query Editor plays the role of an intermediate data container where you can modify data by selecting rows and columns, splitting rows and columns, pivoting and unpivoting columns, etc. The changes made by the Query Editor in Power BI are not reflected in the actual dataset. Once you have pre-processed the data and have transformed it into the required format, you can load the data into the Power BI environment.
Power BI Compatible Data Sources
Power BI is compatible with a large range of data sources. You can click “Get data” on the dashboard as shown in the figure and it will show you all the available data connections.
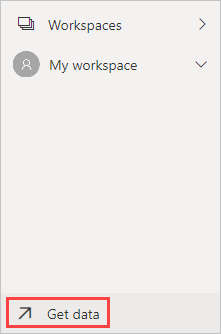
Source: Microsoft
You can connect to different flat files, SQL databases, and Azure cloud or even web platforms such as Facebook, Google Analytics, and Salesforce objects. It also includes an Open Database Connectivity (ODBC) connection to connect to other ODBC data sources. A data consolidation tool offer you the opportunity to integrate power bi into your applications.
Features of Power BI Data Integration
The key features of Power BI data integration are available below. These features explain what things you can do with Power BI and how to do them effectively using the resources already available.
1. Interactive Power BI desktop
The interactive Power BI desktop tool allows you to build reports by accessing the data quickly. Plus, it is free to download and you can create reports without possessing any technical knowledge. It means you can easily import/export data integration for BI using the dashboard and even make changes to the data available for visualizations.
2. Customized Visualization
The Power BI tool has a default standard, which sometimes is not sufficient due to complex data. Under such circumstances, you can easily access the custom library of visualization and design yourself a visualization that serves your needs well.
3. Visibility
Power BI is an effective tool to collect various datasets and organize them visually for better understanding. This helps in delivering a deeper understanding of the data that you can use to enjoy a competitive advantage over other companies in your industry. You can also upload and include a custom visual into the report and then share it with others. Once included in the report, your custom visual behaves exactly like the rest of the native visuals of Power BI. You can filter them, cross highlight, and control their formatting.

Source: Microsoft
Over 120 Power BI Data Connectors
Data connectors extend Power BI’s ability to connect to and access data from 3rd-party applications, web services, online or offline data sources. This enables superior business intelligence and robust analytics that facilitate smart decision-making across the enterprise.
There are more than 120 free data connectors built for extending Microsoft’s Power BI capabilities, which include marketing, sales, project management, productivity, IT, and finance applications.
You can easily integrate power BI with excel, Google Sheets, and even database data. If you are not sure how to do that using Power BI builtin integration features, you can use a data integration tool to do the same for you.
Power BI Data Integration Use-Cases
The main selling point of Power BI is visualization and it delivers on the promise by making data interesting and insightful. The two real-world examples of data integration for BI with power BI software are:
Carnegie Mellon University
Carnegie Mellon University used Power BI big data to furnish employees with maps, visualizations, and dashboards indicating data about their power consumption. This data empowered employees to identify ways to reduce energy usage. With Power BI installed, CMU reduced power consumption by 30%.
Heathrow Airport
Heathrow Airport uses Power BI to visualize the real-time traffic at the airport and enable employees to be prepared with the traffic changing conditions. With Power BI adoption, they can connect with a wide scope of data sources with fewer efforts and use this data to run the airport more smoothly than ever before.
How to Integrate Data for Power BI Use
To make meaningful use of enterprise data, it must be integrated with other data. Astera Centerprise lets you ensure this with an extensive library of connectors for renowned enterprise applications, cloud solutions, databases, and BI and visualization tools. It also supports integration with Power BI. With Astera’s pre-built and -setup connectors, you can integrate all data points and analyze them cohesively for a more holistic view and understanding.
Did you know, data scientists spend 80% of their time cleansing data for analysis? With Astera Centerprise, you can automate and schedule data integrations, set up validation rules, and other advanced transformations to ensure data is in the correct format. Plus, you can extract unstructured documents and other unsupported sources into a format that aligns with PowerBI.
Wrap Up
When it comes to Power BI, it is one tool that allows the process of data analysis to be quick, agile, and user-generated. It not only simplifies the task of data collaboration, reporting, and sharing but also takes the data analytics game to the next level.

